
The liquidity vacuum: Why markets may experience a reality check
Over the weekend, Michael Howell from CrossBorder Capital updated his global liquidity analysis, concluding the sell-off isn’t over for Bitcoin, and elsewhere, accelerating global economic growth will draw liquidity from other asset markets, limiting their upside.
In Bitcoin, while some forecasters eye a rally to $90,000, Howell and the team at CrossBorder Capital have other ideas.
According to Howell, the wind has been knocked out of the sails of the “Everything Bubble”, and if you’re holding out for a vertical move upward, a skid toward $30,000 is the more statistically likely path.
Bitcoin follows the cash
Howell’s research indicates that global liquidity is responsible for 40-45 per cent of systematic movements in Bitcoin’s price. Think of liquidity as the tide: when it’s high, all boats (and digital coins) rise. Right now, however, the liquidity tide is going out. While the 2022–2025 uptrend in liquidity provided support, that trend has officially ended.
Figure 1. Liquidity inching higher
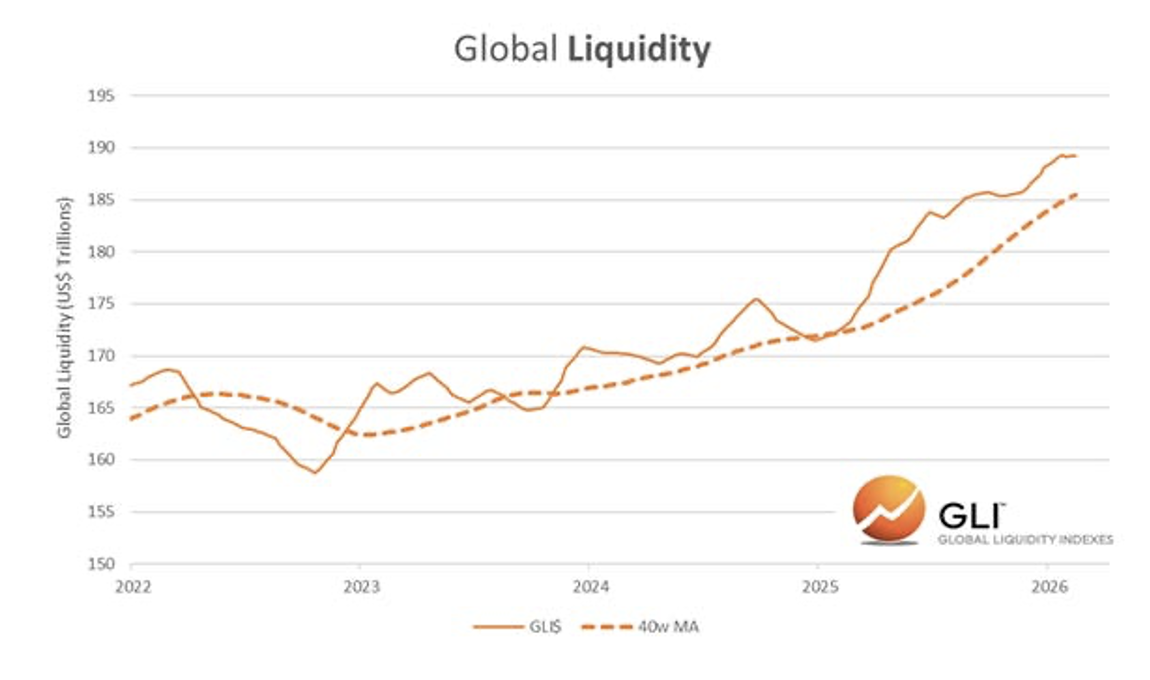
Source: Cross Border Capital
Looking at Figure 1, you might observe liquidity inching higher recently. Howell acknowledges this but dismisses it as a “temporary” blip – a minor bump fueled by two specific events:
- The Federal Reserve’s Reserve Management Purchases (RMP): A “stealth Quantitative Easing (QE)” designed to calm repo market jitters.
- China’s People’s Bank of China (PBoC) Injections: A standard liquidity pump ahead of the Lunar New Year.
The catch? China’s latest Notice #42 explicitly bans residents from dabbling in crypto. So, even if the PBoC floods the zone with Yuan, it’s not flowing into Bitcoin wallets.
Three reasons the outlook is bleak
Howell breaks down the bearish liquidity outlook into three distinct pillars: Cycle, Policy, and Refinancing.
|
Factor |
Current Status |
Impact |
|
Cycle |
Global Liquidity has peaked; entering a downswing. |
Negative: Next trough in BTC isn’t expected until 2027. |
|
Policy |
Fed Chair Kevin Warsh is focused on shrinking the balance sheet. |
Negative: Less “fuel” for risk assets like the S&P 500 and BTC. |
|
Refinancing |
A $45 trillion “Debt Maturity Wall” is approaching by 2030. |
Critical: Debt will “crowd out” investment capital. |
- The cyclical downswing: Main Street vs. Wall Street
According to Howell, global liquidity operates on a 5-6-year cycle, and the firm’s Global Liquidity Index (GLI) indicates we’ve entered a major downswing. Interestingly, this isn’t just about Central Banks tightening; it’s about the Real Economy.
Figure 2. Advanced economies (global) liquidity cycle
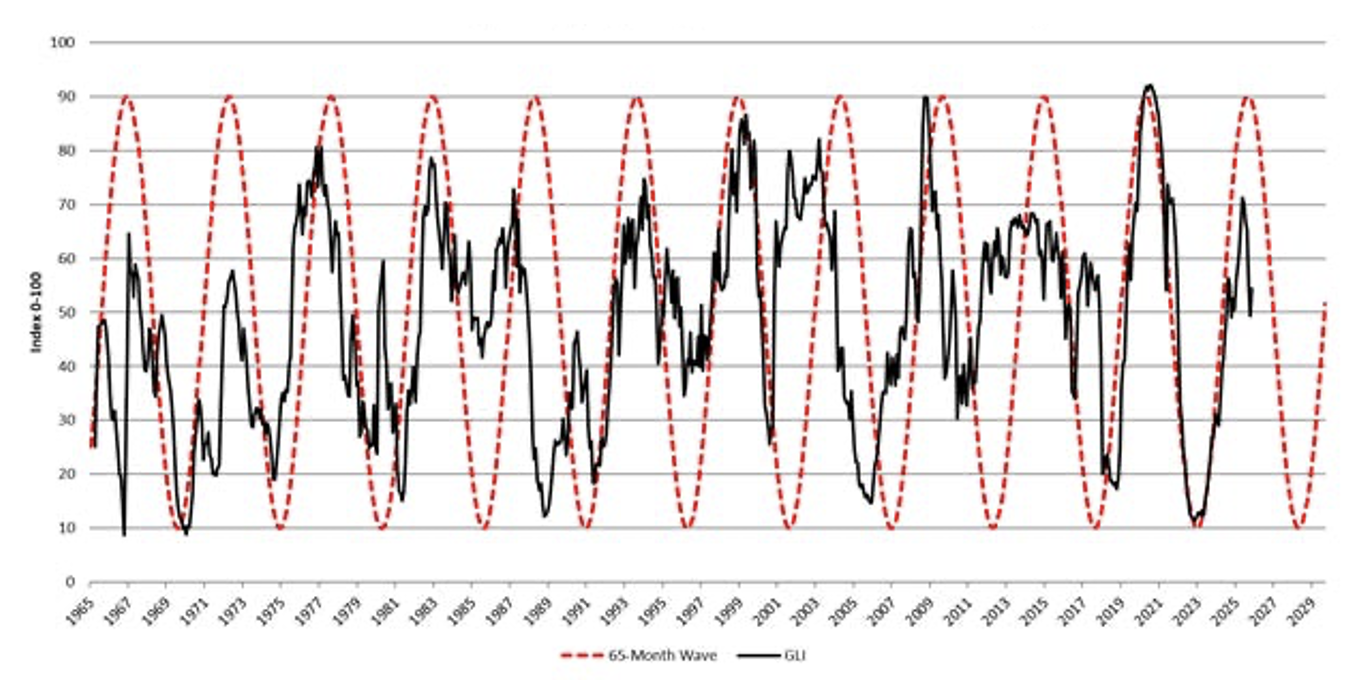
Source: CrossBorder Capital
As the global economy gains traction, it demands more cash for working capital and capital expenditure (capex). In Howell’s words: “All money that is anywhere must be somewhere, and if it’s driving Main Street, it’s not available for Wall Street.”
- Policy uncertainty: The “Warsh” effect
Incoming Federal Chair Kevin Warsh is signalling a desire to reduce the Federal Reserve’s (the Fed) “footprint.” While investors watch interest rates, the real game is the liquidity injected into money markets. We are already seeing “spikes” in the repo markets (the spread between Secured Overnight Financing Rate (SOFR) and Interest on Reserve Balances (IORB), signalling liquidity is already tight. If the Fed continues to shrink its balance sheet by trillions, risk assets will be the first to feel the squeeze.
- The US$45 trillion debt maturity wall
This is perhaps the most daunting part of Howell’s analysis, and something we have alerted investors to since the beginning of last year. During the COVID-19 era, borrowers took advantage of low rates to “term out” their debt. That debt is now coming due.
- By 2030, global refinancing demand will reach US$45 trillion – double 2024 levels.
- 70-80 per cent of capital market transactions are now just “refinancing” old debt rather than creating new value.
- This creates a “liquidity vacuum” where available cash is sucked into servicing old debt rather than buying securities or risk assets such as Bitcoin.
Figure 3. Fed Liquidity and the S&P 500 (lagged 25 weeks)
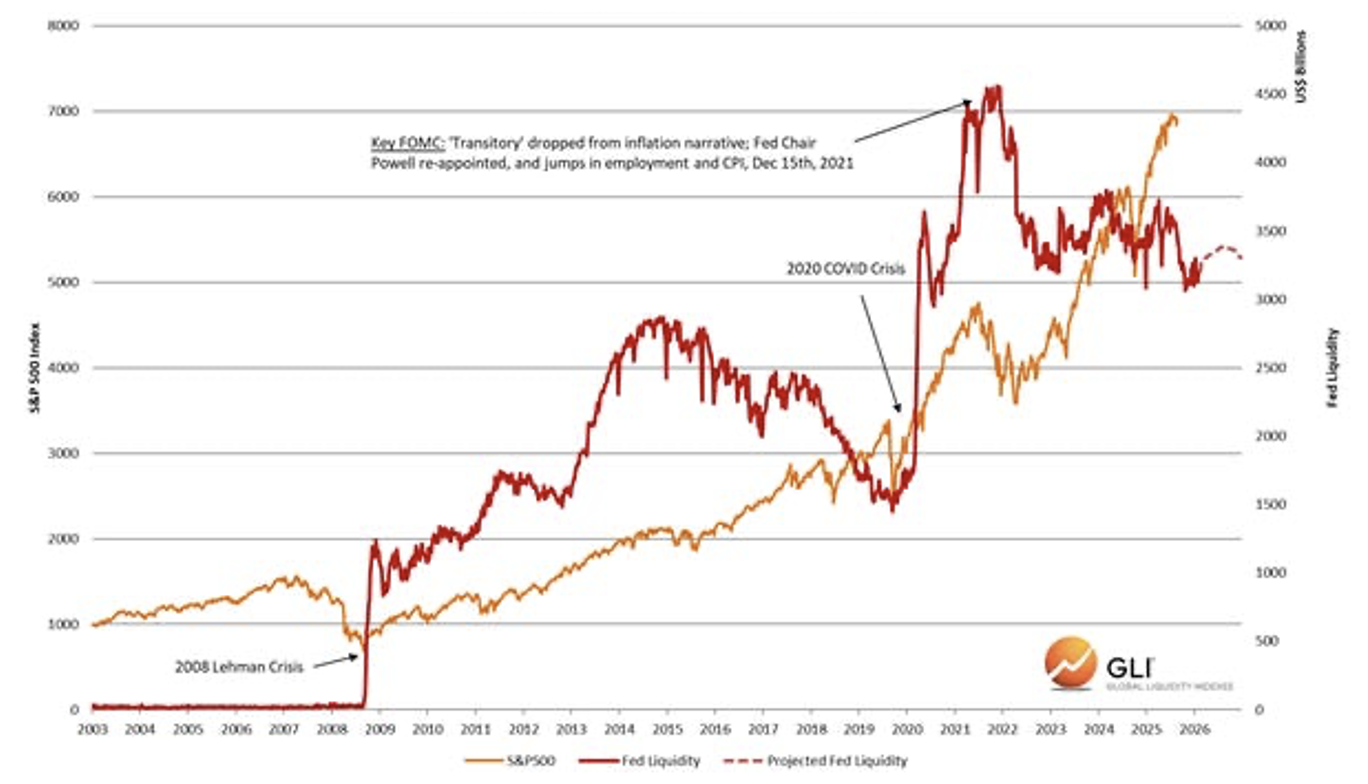
Source: CrossBorder Capital
The silver lining: The “Fed Put” lives on
It’s not all doom and gloom. Howell notes that while the immediate future looks “disappointing,” there is light at the end of the tunnel.
Policy makers cannot let the financial sector fold. Every time a crisis looms (2008, 2020, or the recent repo spikes), Central Banks eventually blink and flood the market with liquidity. The coming “refinancing crisis” will likely force the same reaction.
For that reason, Howell believes owning Bitcoin will still serve as an insurance policy against monetary excess. It needs to be a holding in all portfolios, but he believes there will likely be better opportunities to buy in the months ahead.
Looking at Figure 3., Howell notes, “The correlation is sufficiently close to warn that weak or falling Fed Liquidity is not a great backdrop for risk assets.”
Concluding thoughts
The liquidity taps are being tightened. While Bitcoin remains a vital hedge against the inevitable long-term fiat currency debasement, short-term momentum is pointing down.
If Howell is right, the next target will be toward $30k, not $90k. For patient investors, this shouldn’t be seen as a disaster but a “Buy” signal waiting to happen should the cycle bottom out in 2027.
Roger Montgomery is the Founder and Chairman of Montgomery Investment Management. Roger has over three decades of experience in funds management and related activities, including equities analysis, equity and derivatives strategy, trading and stockbroking. Prior to establishing Montgomery, Roger held positions at Ord Minnett Jardine Fleming, BT (Australia) Limited and Merrill Lynch.
He is also author of best-selling investment guide-book for the stock market, Value.able – how to value the best stocks and buy them for less than they are worth.
Roger appears regularly on television and radio, and in the press, including ABC radio and TV, The Australian and Ausbiz. View upcoming media appearances.
This post was contributed by a representative of Montgomery Investment Management Pty Limited (AFSL No. 354564). The principal purpose of this post is to provide factual information and not provide financial product advice. Additionally, the information provided is not intended to provide any recommendation or opinion about any financial product. Any commentary and statements of opinion however may contain general advice only that is prepared without taking into account your personal objectives, financial circumstances or needs. Because of this, before acting on any of the information provided, you should always consider its appropriateness in light of your personal objectives, financial circumstances and needs and should consider seeking independent advice from a financial advisor if necessary before making any decisions. This post specifically excludes personal advice.