Not All Mortgages Are Created Equal – Part 2
My last post looked beyond the superficial assessment of each bank’s exposure to a deterioration in mortgage book asset quality on the back of any turn in the residential property cycle. In this post, we look at the difference in geographic exposure.
The current performance of residential property markets, and economic growth differs by state, primarily as a result of the relatively large exposure of WA and North QLD to the resources industry, and the bulk of the rotation in economic activity to construction occurring in SE QLD, Sydney and Melbourne.
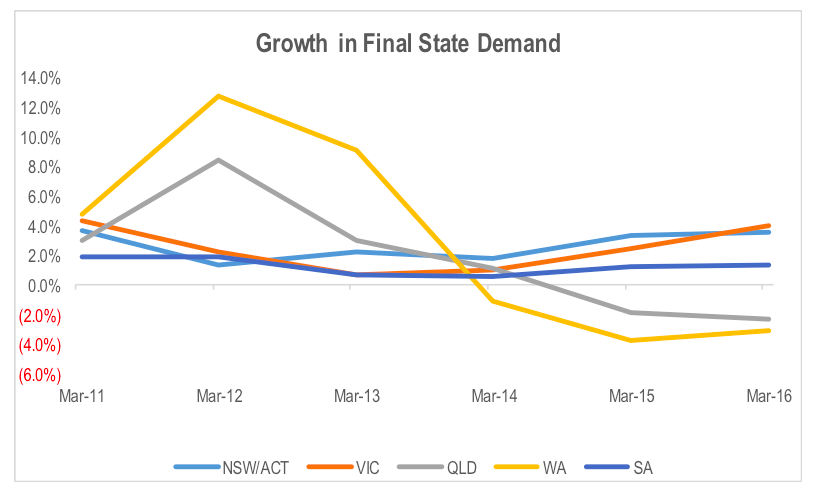
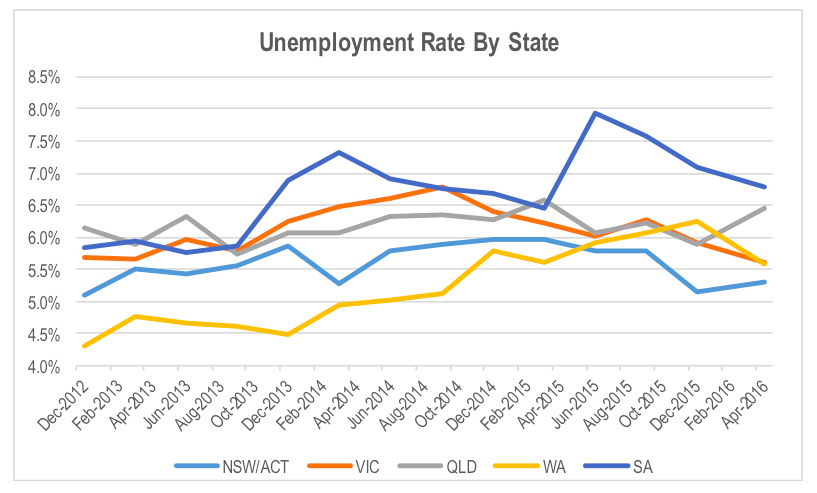
The chart below shows the rotation in the drivers of economic growth nationally, with the slowing and then reversal of economic growth in WA and QLD offset by accelerating growth in NSW and VIC as the construction cycle gathered momentum. This then translates into changes in demand for labour. As the banks generally highlight, spikes in the unemployment rate is the primary driver of mortgage defaults as it impacts the ability of the consumer to meet monthly payments. Unemployment in WA and QLD has now moved above that of NSW and VIC.
 In the most recent bank results period, the majors generally highlighted an increase in delinquencies in their consumer loan books from cyclical lows, but most of the increase was occurring in WA and North QLD. This correlates with the geographic areas of economic weakness in Australia. Not surprisingly, the bulk of the increase in mortgage delinquencies is occurring in WA and QLD as shown in the charts from the result presentations of the major banks.
In the near term, mortgage exposure in WA and North QLD are most at risk of rising defaults and bad debts. Therefore, banks that are more exposed to these geographic regions are more likely to experience higher rates of impairment.
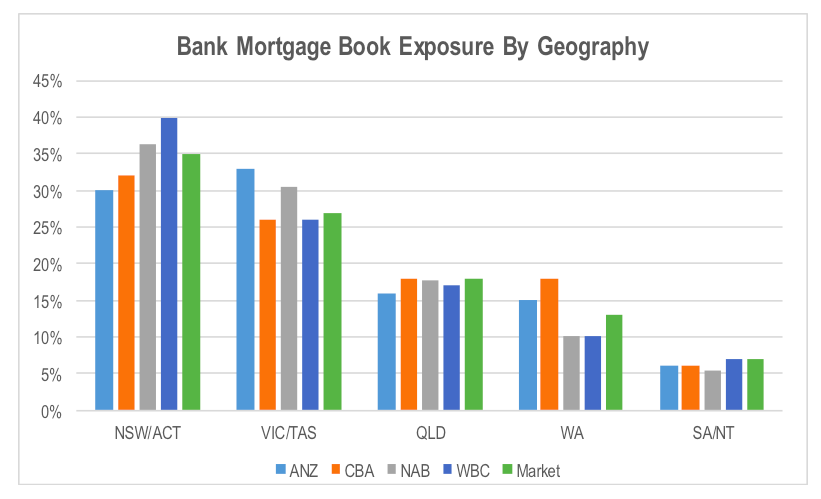
The chart below breaks down each banks mortgage book by state. The weakest residential property markets and economies at present are WA and North QLD. CBA has the largest proportional exposure to WA curtesy of its BankWest acquisition, followed by ANZ.
However, in terms of our concern with the potential for oversupply in high density residential apartments given the volume of new apartments that are due to be settled, the source of asset risk is expected to shift back toward the east coast in the medium term. The chart above shows that ANZ and NAB have greater exposure to VIC while WBC and NAB are relatively more exposed to NSW.
Additionally, ANZ’s strategy of pushing more aggressively into the NSW mortgage market adds to the risk of its exposure to falling residential property prices given they are likely to have higher dynamic LVRs given that its mortgage book is likely to be less mature.
Stuart Jackson is a Senior Analyst with Montgomery Investment Management. To invest with Montgomery domestically and globally, find out more.
This post was contributed by a representative of Montgomery Investment Management Pty Limited (AFSL No. 354564). The principal purpose of this post is to provide factual information and not provide financial product advice. Additionally, the information provided is not intended to provide any recommendation or opinion about any financial product. Any commentary and statements of opinion however may contain general advice only that is prepared without taking into account your personal objectives, financial circumstances or needs. Because of this, before acting on any of the information provided, you should always consider its appropriateness in light of your personal objectives, financial circumstances and needs and should consider seeking independent advice from a financial advisor if necessary before making any decisions. This post specifically excludes personal advice.
INVEST WITH MONTGOMERY
