Montgomery Small Companies Fund – Portfolio Analytics
My colleagues and I have just received an excellent presentation from the Portfolio Managers of the Montgomery Small Companies Fund, Gary Rollo and Dominic Rose. To remind readers, the fund was launched on 20 September 2019 and in the twenty-five months to 31 October 2021 the Fund had turned $1.00 into $1.63, inclusive of distributions, out-performance relative to the S&P/ASX Small Ordinaries Accumulation Index (Benchmark), which had turned $1.00 into $1.27.
The past six months has been a rough period for most investors, particularly those with a growth bias, and the Montgomery Small Companies Fund has retraced around 17 per cent, whilst the Benchmark has retraced around 6 per cent. Consequently, over the thirty-one months to April 2022, early investors in the Montgomery Small Companies Fund had turned $1.00 into $1.36, whilst the Benchmark had turned $1.00 into $1.21.
The presentation from Gary Rollo and Dominic Rose focussing on the Portfolio Analytics of the fund was most interesting, and I thought it would be a valuable exercise to reiterate the highlights here.
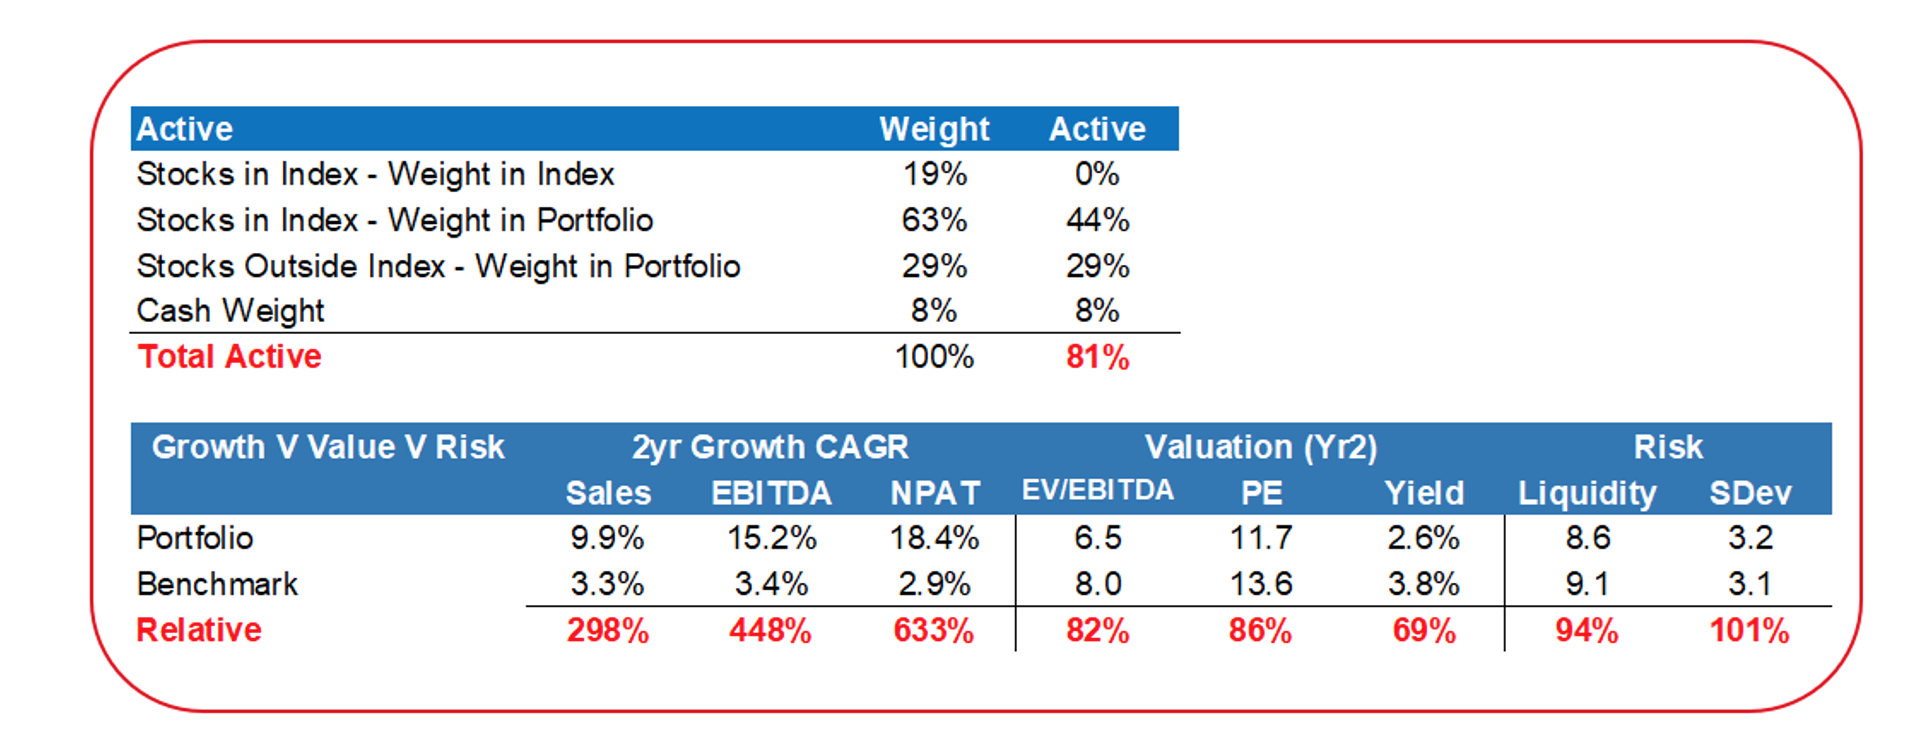
- The Portfolio is expected to record revenue growth approaching 10 per cent per annum over the next two years, approximately triple the Benchmark’s revenue growth of 3.3 per cent per annum.
- The Portfolio is expected to record EBITDA growth of 15 per cent per annum over the next two years, compared with the Benchmark’s 3.4 per cent per annum.
- The Portfolio is expected to record NPAT (Net Profit after Tax) growth of 18 per cent per annum over the next two years, compared with the Benchmark’s 2.9 per cent per annum.
- From a valuation perspective, the Portfolio is selling on an EV/EBITDA (Enterprise Value to Earnings before Interest, Tax, Depreciation and Amortisation) ratio of 6.5X (two years out) and this is an 18 per cent discount to the Benchmark’s 8.0X.
- And finally, the Portfolio is selling on a PE (Price/Earnings) ratio of 11.7X (two years out) and this is a 14 per cent discount to the Benchmark’s 13.6X.
In summary, the portfolio – over the next two years – is growing at 3X faster than the Benchmark at the revenue line, 4.5X faster at the EBITDA line and 6X faster at the NPAT line.
Nevertheless, from a valuation perspective, the Montgomery Small Companies Fund relative to the Benchmark two years out, is selling at an 18 per cent discount at the EV/EBITDA line and a 14 per cent discount at the NPAT line.
Relative to the Benchmark, the Portfolio offers strong growth at a discounted valuation.

