
What the smart money does at the beginning…
There are many consequences of gold’s vertical ascent to new all-time highs. One of course, is the queues of first-time buyers forming outside gold bullion stores around the world. A more subtle consequence, however, is the emergence of arguments that justify the rally and inspire those queues.
Throughout history, gold has functioned as both a store of value and a safe haven during times of monetary, political, and economic upheaval. Unlike fiat currencies or the assets of specific corporations, gold’s value isn’t linked to the fortunes of any one nation’s economy. This quality renders it especially attractive during crises such as wars, rising inflation, financial downturns, and global health emergencies. Its reputation for stability, its widespread recognition and universal and historical acceptability, has positioned gold as a go-to hedge against systemic threats and the erosion of currency value.
Indeed, we could go a step further and argue that not only does gold continue to play a dual role as a hedge in normal times and a safe haven in times of crisis, but it’s therefore also an indispensable asset for portfolio management, especially when evaluated amidst a tail-risk framework.
Figure 1. Gold price (USD/t oz)
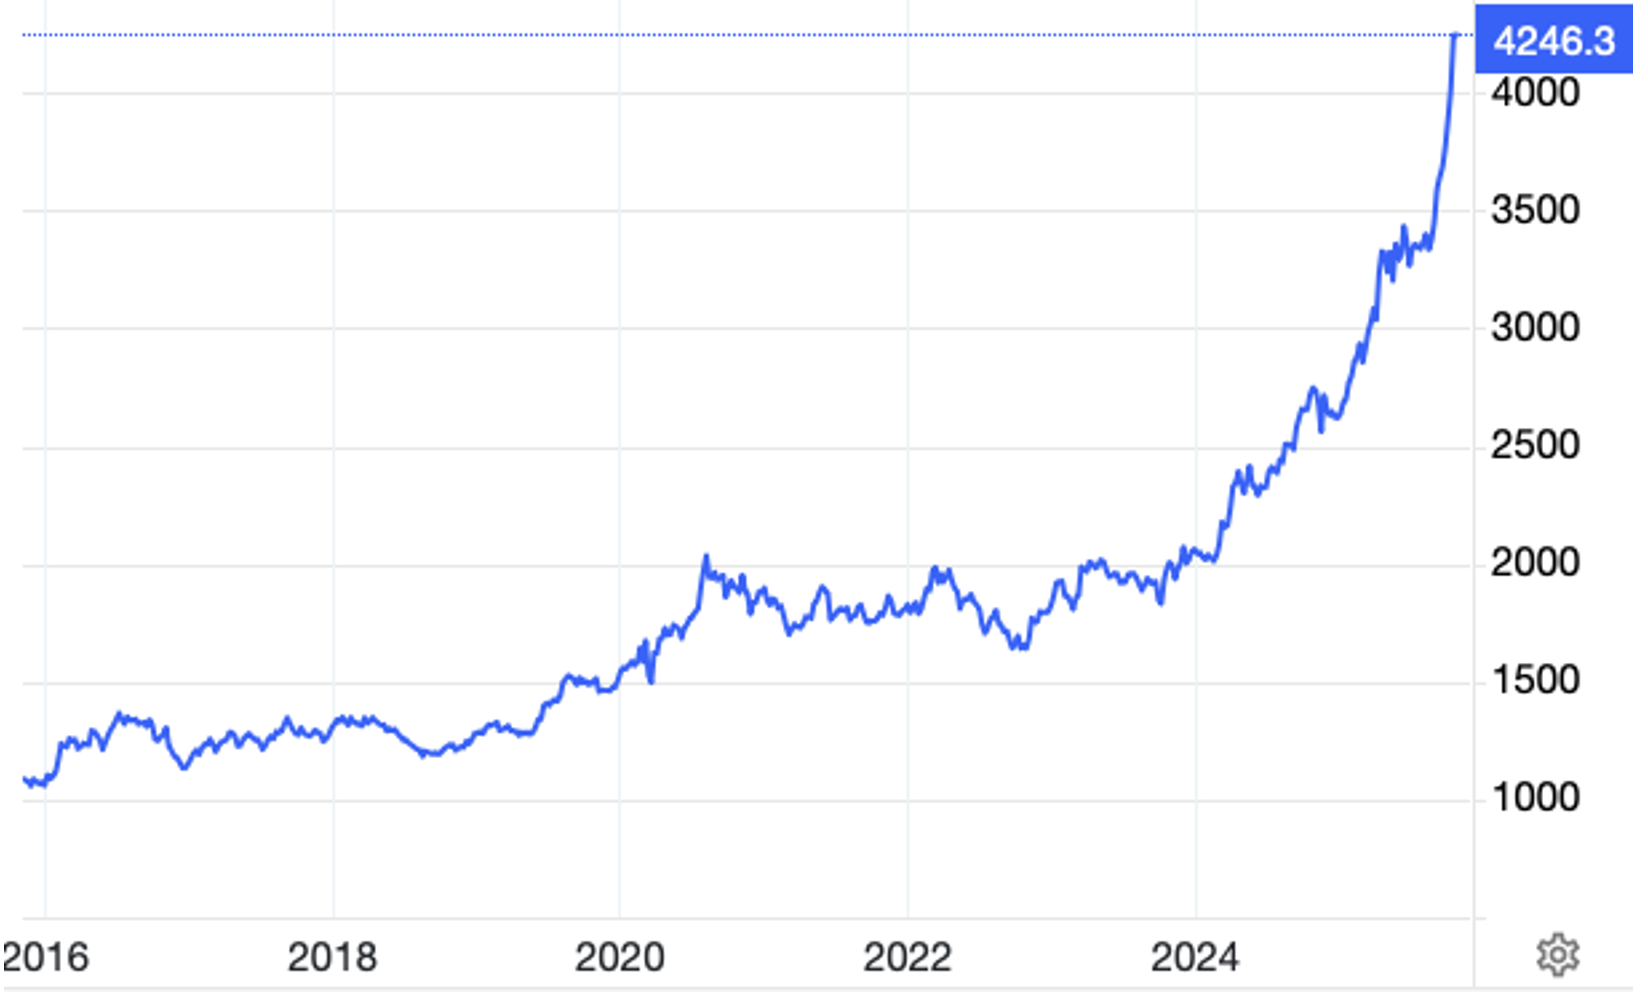
Source: Trading Economics
Those arguments, however, are not new, and neither are the arguments being proffered today for justifying gold’s ascent.
The primary driver behind gold’s unprecedented surge over the past three years has been Russia’s incursion into Ukraine, coupled with a mercantile U.S. President, under whom the U.S. has maintained its confiscation of the Kremlin’s treasury holdings. This move led many international central banks to reassess the security of their U.S. treasury investments during periods of heightened instability. Many nations are reportedly now concerned that displeasing Trump could result in their foreign currency reserves being locked.
This has also fuelled the de-dollarisation theme – the idea that global central banks are turning their back on U.S. dollars, accelerating a decline already underway amid ballooning U.S. debt and money printing. In a world of declining faith in fiat currencies, gold (and Bitcoin) becomes a wise alternative, especially when global institutions (central banks) are validating the gold trade (Figure 2).
Figure 2. China’s gold inventory (2009-2025)
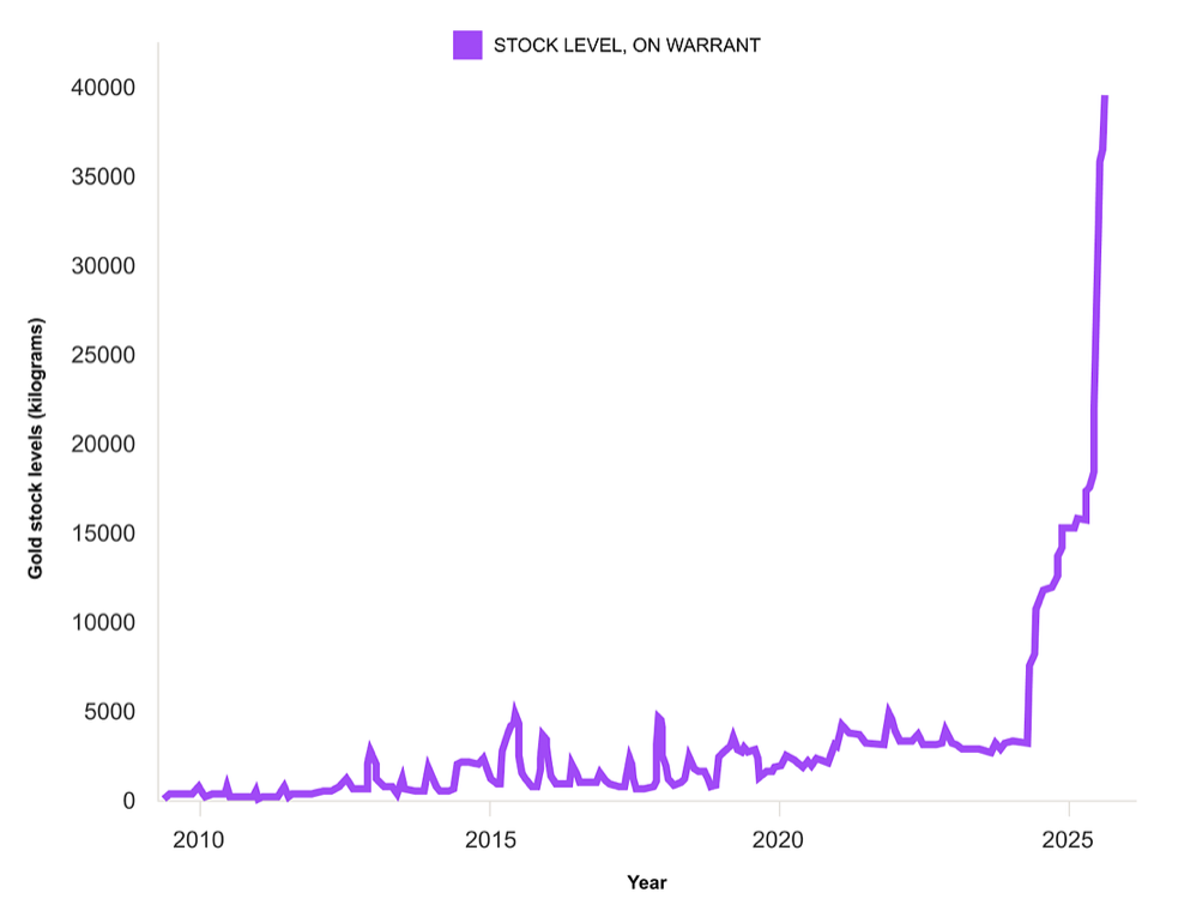
Source: Bloomberg, Shanghai Gold Exchange, Steno Research
Combined with gold’s surging price, central bank gold buying has caused the value of global central bank gold holdings to surpass their holdings of U.S. Treasuries for the first time in 30 years (Figure 3).
Figure 3. Foreign central banks hold more gold than treasuries (% of international reserves).
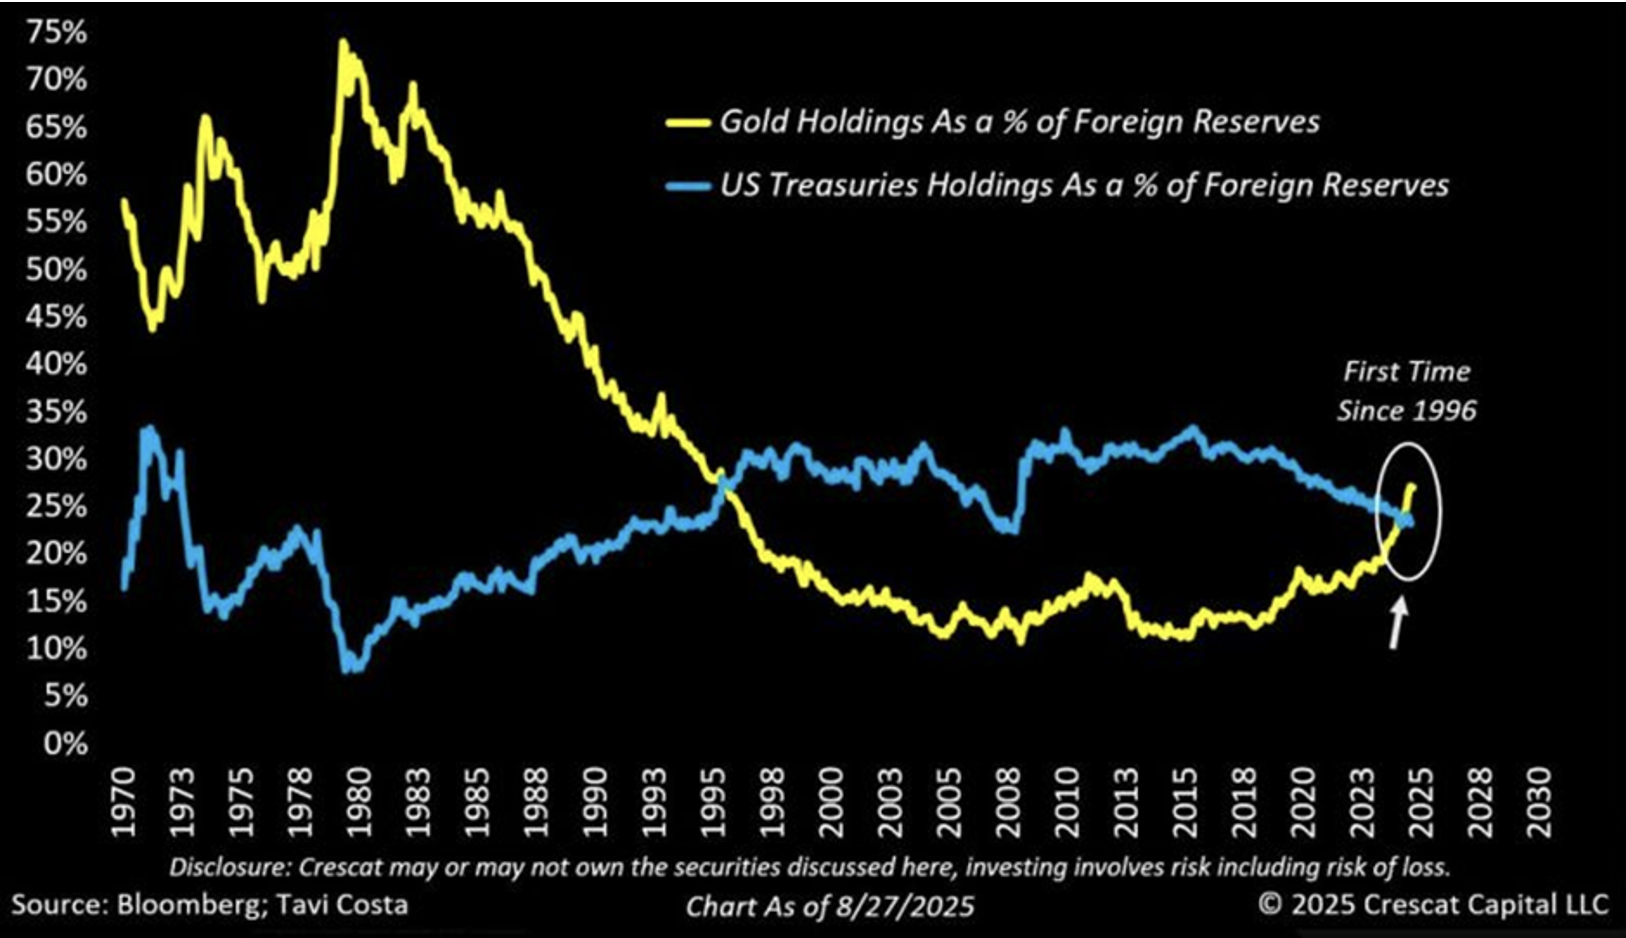
Source: Bloomberg, Tavis Costa
The debate about whether gold’s price will continue to rise, or correct after its vertical ascent, will continue. The problem for investors, however, is that the higher gold rises, the lower an investor’s future return from buying it.
Remember, most of the arguments being used to justify today’s buying are the same arguments that were promoted three years ago – when the so-called ‘smart’ money was buying gold.
“What we call the beginning is often the end. And to make an end is to make a beginning. The end is where we start from.”
Four Quartets, T.S. Elliot
What’s old is new again
For many commentators, trotting out the same gold buying arguments for three consecutive years becomes tiresome – as it does for their audience. What I have seen on many occasions is the longer a rally persists, the more esoteric the bull narratives become.
Most recently, an emerging body of work argues gold’s rally is only just beginning. The argument says: “From time to time, investors rotate between financial assets and hard assets; and we’re witnessing the early stages of one of the most significant rotations in modern history.”
That argument – that gold is ‘undervalued’ – is now supported by the chart shown in Figure 4, with one commentator noting, “When priced in gold, the S&P 500 is only now retesting levels last seen at the 1929 market peak.” We’ll ignore the fact that in 1929 the ratio rose to its peak, while today it is falling to the same ‘peak’. We will also ignore the fact the so-called ‘peak’ level appears to have been ‘retested’ four times since 2015 and another five times between 1929 and 2015. Indeed, the sentence might more accurately have read, ‘When priced in gold, the S&P 500 is again retesting levels seen many times since 1929.’
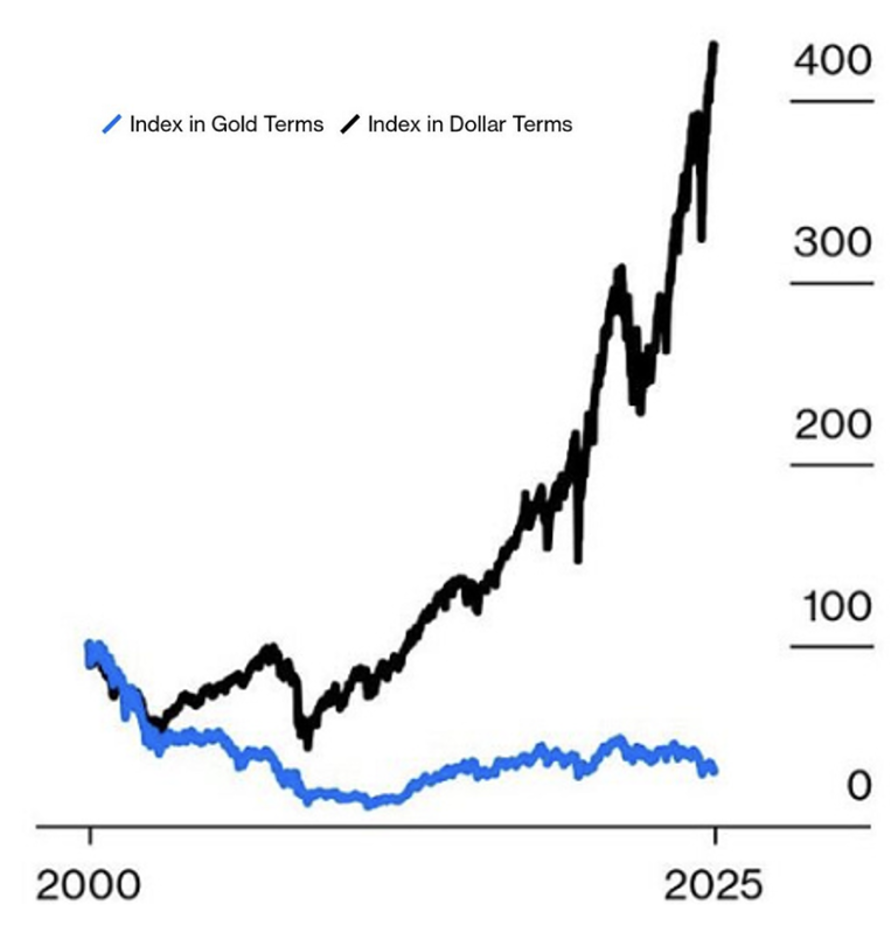
Figure 4. S&P 500 in gold terms
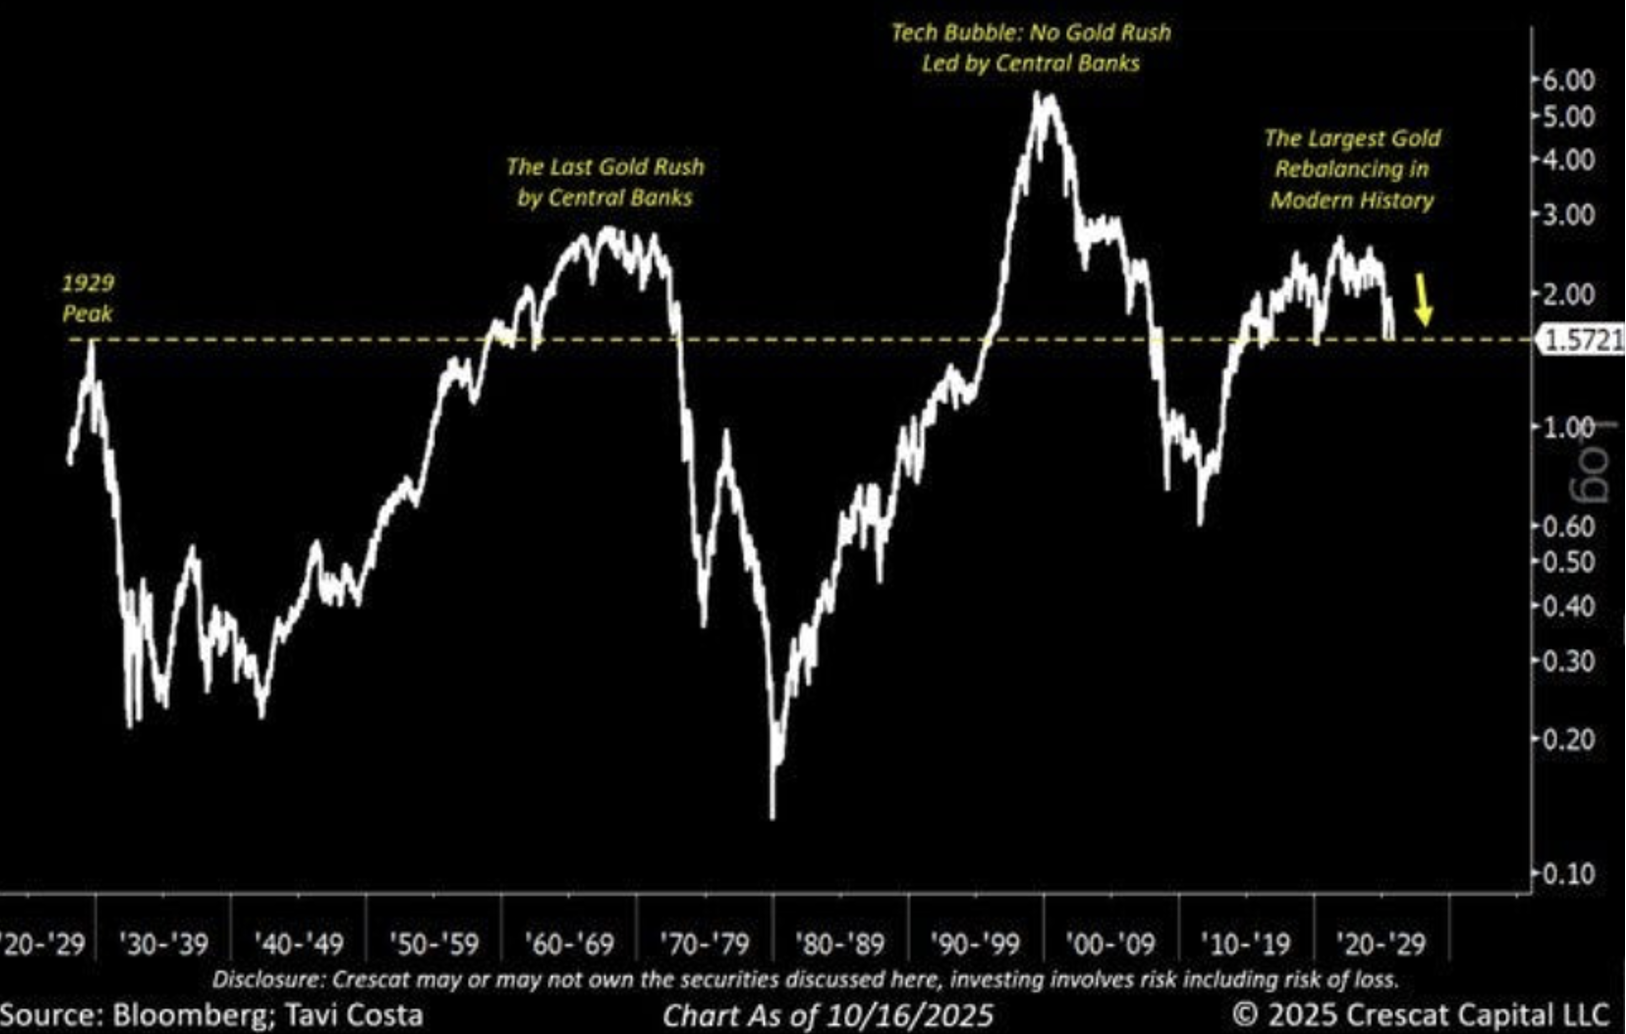
Figure 4., divides the S&P500 index level by the price of gold per ounce to reveal the historical ratio of the S&P 500 index value to the price of gold (i.e., how many ounces of gold the S&P 500 could theoretically buy) from 1929 to October 16, 2025. The y-axis represents the ratio, with higher values indicating the S&P 500’s value in gold terms is high (stocks outperforming gold), and lower values indicating the reverse (gold outperforming stocks
Figure 5. Gold takes the shine off MSCI U.S. stocks
Source: Bloomberg, Wall Street Journal (WSJ)
Figure 5., plots the same thing in blue but over a shorter period and against the USD-denominated index we are all familiar with. It shows that while the stock market has risen materially since the dot-com bubble, benchmarking its performance against gold reveals the market has been falling ever since the start of the millennium.
According to its promoter, Figure 4., reveals one of the most important valuation signals in financial markets: the S&P 500 priced in gold terms. This ratio strips away the noise of currency debasement and inflation to show the true relative value between financial assets and hard assets.
The small recent drop in Figure 4., over the last year, reflects the fact gold has already materially outperformed the S&P 500, as shown in Figure 6.
Figure 6. Major asset class performances.
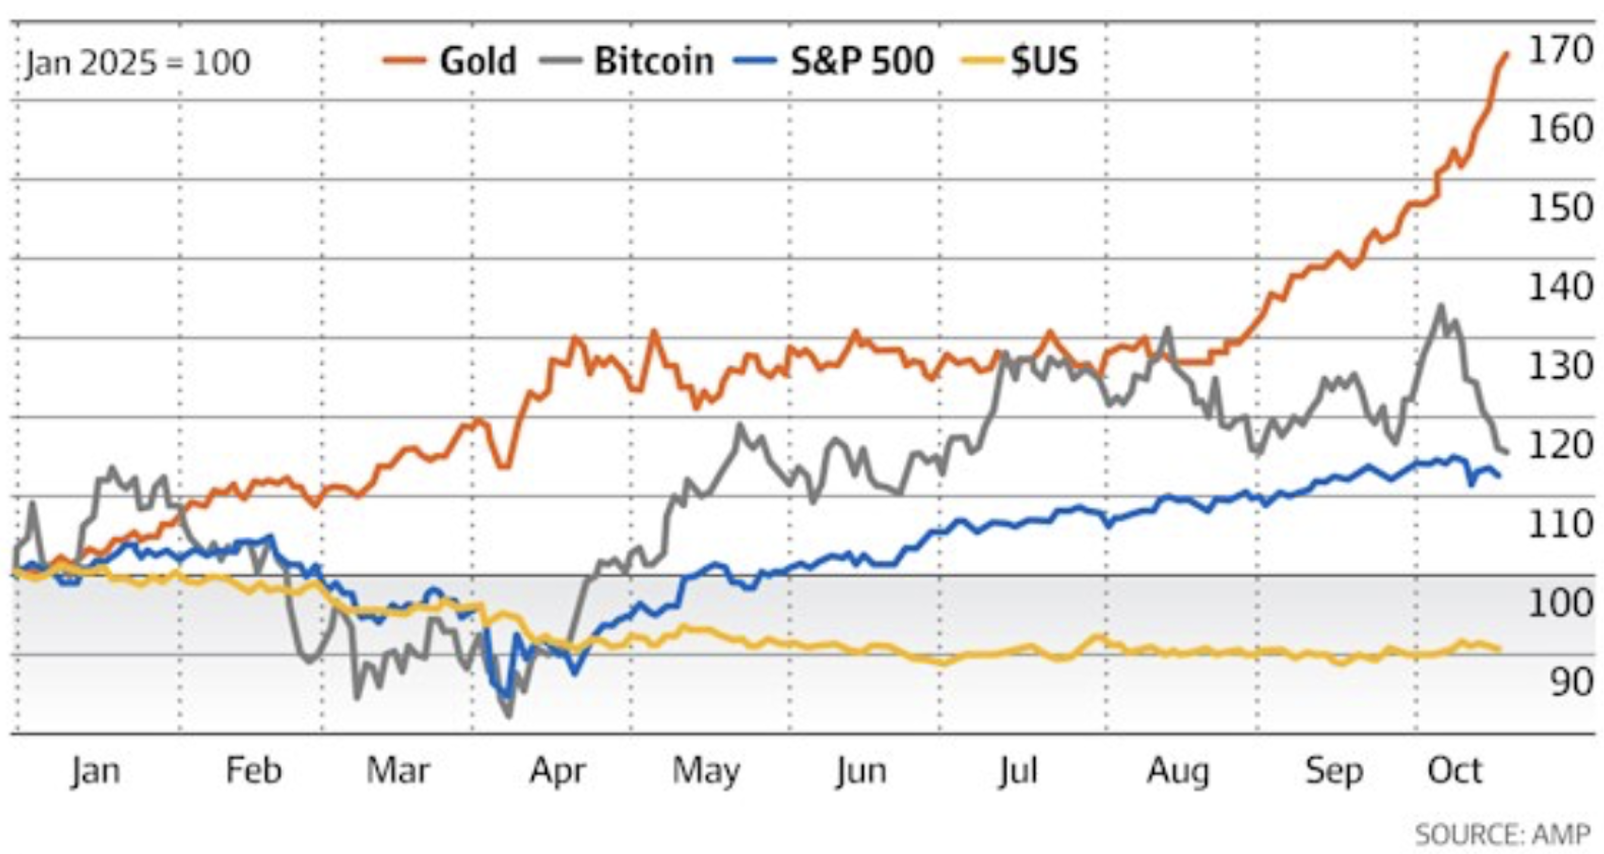
Source: AMP
A plot not a prediction
The limitation with Figures 4., and 5., is they show nothing more than asset class relative performance. While they purport to offer some predictive power, they do nothing of the sort.
Some gold bulls now, however, believe the only logical path for the line in Figure 3 is an even more deeply negative dive, as has occurred in past episodes of the line falling. They argue financial assets have become so expensive relative to gold that we’re approaching historical extremes that have always marked major turning points. As an interpretation, that’s a stretch, as is attributing any predictive power to the chart itself.
The chart shows four major peaks in the S&P 500/Gold ratio: 1- 1929, 2- the 1960s-70s Nifty Fifty bubble, 3- the tech bubble around 2000, and 4- today. Each peak was followed by a massive rotation from financial assets to hard assets.
The 1929 peak was followed by one of the largest gold revaluations in American history. The tech bubble peak in 2000 was followed by gold’s rise from ~$250 to $1,900. And the argument now proposes: “Today’s setup suggests an even more dramatic rebalancing is coming.” This is a claim that clearly cannot be justified from observing the chart alone.
As the chart is dependent on the price of each ‘asset’, a crash in the S&P 500, for example, with the gold price remaining where it is, would also produce the predicted drawdown in the chart.
Historically, the ratio peaked around 1929 at approximately 1.57, reflecting a high stock market valuation relative to gold before the Great Depression.
It dropped sharply in the 1930s-’40s, hitting lows below 0.20, as gold gained value during economic hardship. A significant rise occurred in the 1960s-’70s as gold rallied amid high inflation driven by oil price shocks (e.g., OPEC’s 1973 embargo), which eroded fiat currency value; the U.S. abandonment of the gold standard in 1971, leading to floating exchange rates and uncertainty; and geopolitical tensions, including the Cold War. Central banks and investors turned to gold as a hedge, pushing its price from US$35 per ounce in 1971 to a peak of US$850 by 1980.
The ratio then peaked again in the late 1990s during the tech bubble, driven by central bank policies and stock market growth, before crashing sharply by 2011 post-financial crisis.
Annotating the past, however, isn’t the same as predicting the future.
Indeed, this metric can be misleading without considering dividends, inflation, or total returns, as it oversimplifies complex market dynamics.
Comparing the S&P 500 (or any stock index) to its value denominated in gold has gained popularity recently, but there are several methodological and conceptual flaws, which can lead to misleading conclusions, such as overemphasising gold’s superiority as a long-term asset or an ability to time market shifts based on the ratio alone.
Flaws in the comparisons
The S&P 500 is often quoted as a price index, but it represents productive businesses that distribute earnings. Its true economic value, therefore, includes reinvested dividends, which have historically contributed 30-40 per cent of long-term returns.
This is borne out in studies by Morningstar and Standard & Poor. From 1926 to 2020, the S&P 500’s average annual total return (including dividends) was about 10 per cent, while its capital return alone was around 7-8 per cent.
Gold, however, is a non-yielding, and therefore ‘barren’ asset, generating returns solely from price changes. When comparing the S&P 500 priced in gold sans total return, analyses understate the equity asset class’s performance.
By way of example, from 1970 to 2020, gold’s raw price return appeared to outperform the S&P 500 price index (5,333 per cent vs. 3,737 per cent), but including dividends flips this: the S&P 500 total return surges to over 7,000 per cent, far exceeding gold.
Similarly, 20-year data (2004-2024) shows gold up circa 585 per cent versus the S&P 500 price index return of circa 500 per cent, but total return pushes the S&P 500’s return to just under 600 per cent, again erasing gold’s edge.
Over 30 years, according to Morningstar (1994-2024), gold’s annualised total return is just under 8.00 per cent, versus the S&P 500’s 10.67 per cent, which of course, to a lesser extent, is also reflected in Figure 3.
Another ‘issue’ is that the analyses often commence post-peak (e.g., the 1929 or 2000 stock market bubbles), potentially rendering gold invincible, but the correlations are unstable, and gold and stocks can move together during crashes (e.g., the March 2020 COVID pandemic drop). To that point, the World Gold Council’s data reveals gold’s stock market correlation averages about 0.2 over 10 years, spiking positively during expansions and decouples only in crises.
According to Mercer, from 1987-2001, gold fell despite average inflation of around three per cent. Meanwhile, ScienceDirect research (2020) using GARCH models (Generalised Autoregressive Conditional Heteroskedasticity statistical models used to analyse and forecast volatility in financial time series data) found gold hedged stock volatility mainly under high geopolitical risk, but not routine inflation – e.g., it underperformed stocks/bonds from 1980-2008 despite moderate inflation.
All the above examples serve to demonstrate the ratio in Figure 3., implies a stable inverse relationship, but at best, the plot is a barometer for risk appetite or fear, not a predictor. High ratios, therefore, merely reflect equity optimism, while lows signal fear – remembering gold is a bet on fear. Indeed, even the often bearish Ray Dalio suggests holding up to 15 per cent of a portfolio in gold for hedging, but not as a core holding.
Investors, including gold bulls and bears, should largely ignore these stock-index-to-gold comparisons – certainly for any predictive value.
While the S&P 500-to-gold ratio can signal short-term sentiment shifts (e.g., fleeing risk to safe havens), it’s a poor standalone tool for allocation.
These Johnny-come-lately charts and comparisons fuel gold bugs’ narratives and promote speculation over evidence-based investing. It would be nice if there was a single indicator that could reliably predict which asset class will generate the best return over the next five or ten years. But there isn’t one. And the S&P 500 priced in gold isn’t one either. If you’re building a portfolio, focus on your time horizon, risk tolerance, and total returns. You can add some spice by being greedy when others are fearful and fearful when others are greedy. And if you still need more spice, be sure only to punt an amount you’re willing to lose.
Roger Montgomery is the Founder and Chairman of Montgomery Investment Management. Roger has over three decades of experience in funds management and related activities, including equities analysis, equity and derivatives strategy, trading and stockbroking. Prior to establishing Montgomery, Roger held positions at Ord Minnett Jardine Fleming, BT (Australia) Limited and Merrill Lynch.
He is also author of best-selling investment guide-book for the stock market, Value.able – how to value the best stocks and buy them for less than they are worth.
Roger appears regularly on television and radio, and in the press, including ABC radio and TV, The Australian and Ausbiz. View upcoming media appearances.
This post was contributed by a representative of Montgomery Investment Management Pty Limited (AFSL No. 354564). The principal purpose of this post is to provide factual information and not provide financial product advice. Additionally, the information provided is not intended to provide any recommendation or opinion about any financial product. Any commentary and statements of opinion however may contain general advice only that is prepared without taking into account your personal objectives, financial circumstances or needs. Because of this, before acting on any of the information provided, you should always consider its appropriateness in light of your personal objectives, financial circumstances and needs and should consider seeking independent advice from a financial advisor if necessary before making any decisions. This post specifically excludes personal advice.