
A look at what drove the Australian equity market over the last year
On Monday, the S&P/ASX 200 Index reached a new all-time high, crossing the illustrious 8,000-point mark. For anyone closely tracking Australian equity markets over the last year, particularly those for large caps (notably the ASX 100 and ASX 200 indices), this may not come at a surprise. In fact, the S&P/ASX 300 Accumulation Index, which is most commonly used as a proxy for the broader Australian equity market, boasted a 12 per cent return for fiscal year 2024.
All in all, this would suggest the last twelve months have generally been strong for a majority of Australian listed companies. However, when you have a look at the sectors and underlying companies which contributed to this outcome, the story is a little different.
Sector drivers
The best-performing sector from a total return perspective in fiscal year 2024 was financials (+29 per cent), closely followed by information technology (+28 per cent). Consumer staples (-4 per cent) were the worst performing sector, followed by materials, which were also down in aggregate for the twelve-month period (-2 per cent). These vast sector outcomes suggest it was a bifurcated market. This becomes even more evident when you start to consider index weights to these sectors and, consequently, what actually drove the broader market’s 12 per cent return. This is charted below. Despite financials and information technology having almost identical total returns for the fiscal year, financials accounted for 65 per cent of the S&P/ASX 300 Accumulation Index’s 12 per cent return, while information technology contributed just 6 per cent. This is because the financials sector accounted for almost 29 per cent of the S&P/ASX 300 Accumulation Index’s total market capitalisation as of 30 June 2024, with information technology comprising less than 3 per cent.
Figure 1: S&P/ASX300 12 month sector contribution to return (%)
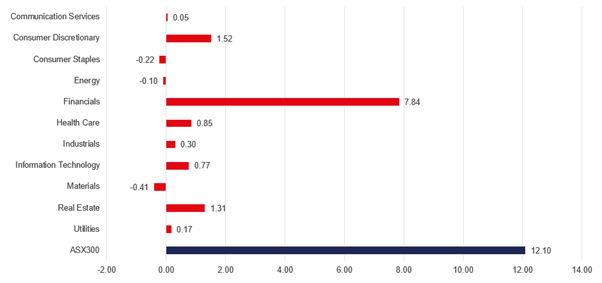
Source: Montgomery/Bloomberg as at 30 June 2024. The index attribution has been sourced via a proxy index for the S&P/ASX 300 Accumulation Index, being the Vanguard Australian Shares Index ETF.
Company drivers
Zip Co Ltd (ASX:ZIP) (+256 per cent) took the title as the best-performing ASX 300 company from a total return perspective in fiscal year 2024 and was, not as closely, followed by a more noted market darling in Pro Medicus Ltd (ASX:PME) (+119 per cent). Sadly, for holders, Core Lithium Ltd (ASX:CXO) (-90 per cent) was the worst performing company in the ASX 300, more closely followed by two other materials companies, Sayona Mining Ltd (ASX:SYA) and Lake Resources (ASX:LKE) (both declining -77 per cent).
Similar to the sector drivers, when you consider the actual weights of these companies in the broader index and, therefore, their contribution to return, we see the dominance of financials reemerge. This is depicted in the table below. In fact, the top six companies accounted for more than 70 per cent of the broader market’s return over the last 12 months. Also, within these six, the “big four” banks alone accounted for more than 50 per cent of the S&P/ASX 300 Accumulation Index’s 12 per cent return. Is this Australia’s answer to the “Magnificent Seven” with the “Aussie Six”? Whilst some of these Australian businesses are undoubtedly of high-quality, your author would strongly suggest they don’t have the earnings growth power of their global counterparts.
Table 1: S&P/ASX 300 Accumulation Index 12-month top six companies’ contribution to return (%)
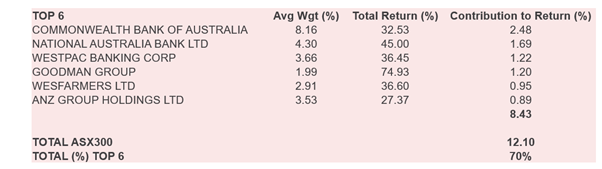
Source: Montgomery/Bloomberg as at 30 June 2024. The index attribution has been sourced via a proxy index for the S&P/ASX 300 Accumulation Index, being the Vanguard Australian Shares Index ETF.
Following the release of a promising U.S. consumer price index (CPI) print last week, which saw annualised inflation in the U.S. decline to 3.0 per cent, investors on Wall Street have begun to drive a clear rotation from shares of mega-cap tech companies to small-cap stocks, buoyed by the expectation of interest rate cuts before the year’s end. Will fiscal year 2025 bring a similar broadening of the market in Australia?
Dean Curnow joined Montgomery Investment Management in June 2016.
Dean joined the firm from Colonial First State, where he was a Consultant for Retail Sales for 2 years.
Prior to this, Dean was also a Relationship Manager with the Commonwealth Bank of Australia, where he spent 5 years working in Retail Banking.
This post was contributed by a representative of Montgomery Investment Management Pty Limited (AFSL No. 354564). The principal purpose of this post is to provide factual information and not provide financial product advice. Additionally, the information provided is not intended to provide any recommendation or opinion about any financial product. Any commentary and statements of opinion however may contain general advice only that is prepared without taking into account your personal objectives, financial circumstances or needs. Because of this, before acting on any of the information provided, you should always consider its appropriateness in light of your personal objectives, financial circumstances and needs and should consider seeking independent advice from a financial advisor if necessary before making any decisions. This post specifically excludes personal advice.