“The Next Economic Disaster”
In an empirical study detailed in his book “The Next Economic Disaster: Why It’s Coming and How to Avoid It”, Richard Vague concluded that crises occur when a country’s private sector debt exceeds 150 per cent of GDP; and when the level of private sector debt grows by 20 per cent (from say 140 per cent to 160 per cent of GDP) over a five year period.
The Bank of International Settlement (BIS) publishes a quarterly series of debt data for 40 countries and from that data Steve Keen, the perpetual bear, has concluded in a recent Forbes article there are seven countries which have a private sector debt to GDP ratio in excess of 175 per cent and in the past year the increase in that private sector debt exceeded 10 per cent of GDP.
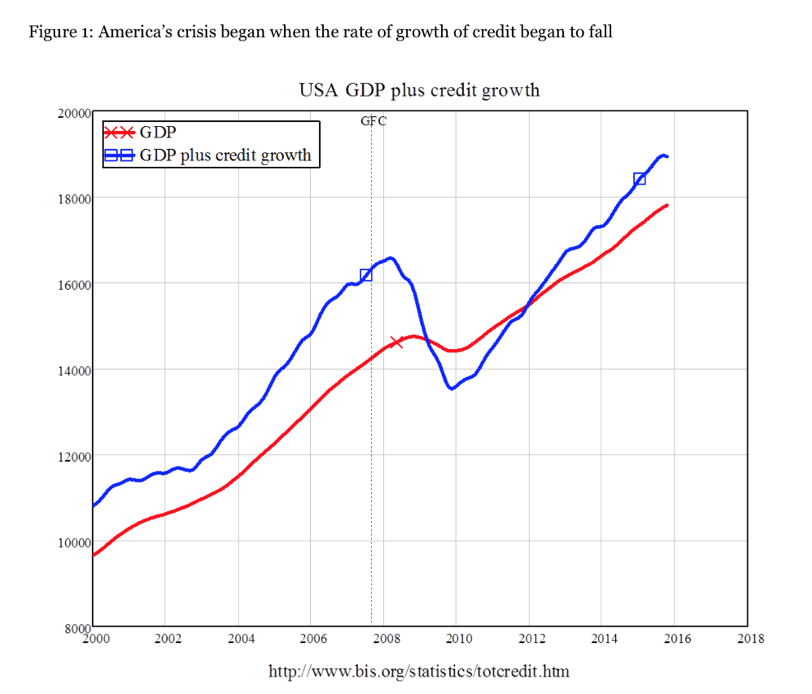
China, Australia, Sweden, Hong Kong, South Korea, Canada and Norway are “most likely to suffer a debt crisis” within the next three years, according to Keen. “When the growth of credit falls—as it eventually must, as growing debt servicing exhausts the funds available to finance it, new borrowers baulk at entry costs to house purchases, and numerous euphoric and Ponzi-based debt-financed schemes fail—then the change in credit falls, and can go negative, thus reducing demand rather than adding to it”. This was certainly the case in the US between 2008 and 2010, as illustrated in the graph below.
And this comes at a time when Australian banks are taking a tougher stance on their lending criteria, indicating a reduced willingness by the banking sector to lend. 
To learn more about our funds, please click here, or contact me, David Buckland, on 02 8046 5000 or at dbuckland@montinvest.com.
Adding to the above graphs, I would like to see an overlap graph that includes the S&P500.
Morning
I would be interested if the Montgomeries have a ‘take’ on this scenario.
Regards
Mark
Hi Mark,
the major issues for me include:
1. China’s private sector debt to GDP ratio has rocketed from 150 per cent to around 210 per cent in the past six years.
The misuse of debt has seen overcapacity of housing, steel, cement etc. and the recent policy easing will likely further accentuate this issue.
China’s total property inventory, for example, has jumped from around 500 million square metres to nearly 750 million square metres over the past two years.
(According to the Survey and Research Center for China Household Finance, more than one in five homes in China’s urban areas is vacant).
2. With severe overcapacity comes problem loans from the financial sector. Recent examples include housing in the US in 2008 and commercial real estate in Japan in 1991.
Some commentators believe Chinese banks’ aggregate problem loans are a staggering US$2-$3 trillion, and this compares with their US$1.5 trillion of capital.
(Coincidentally, these were similar numbers for the US banking system in 2007, however the US economy is around 70 per cent larger than the Chinese economy.
Also note, US private sector debt to GDP has declined from 167 per cent in 2008 to the current 143 per cent).
So we await for the Chinese banks and shadow banks to come clean on their loan loss provisions, and relatively low global demand growth for China’s exports will be of limited assistance.
3. Today, around 34 per cent of Australia’s exports go to China, and five per cent go to the US. Ten years ago these figures were 11 per cent and eight per cent, respectively.
So while Australia has enjoyed a wonderful ride due the “pull-up effect” from China, my take is this party to end all parties will soon promote a large hangover.