
Is it helpful to compare historical market values?
Like me, you’ve probably seen or read a number of industry professionals talk about the value of the overall market and, in particular, the PE ratio of the market relative to its longer term history. But how helpful is this when it comes to making investment decisions?
The chart below is a typical representation of this, which shows the PE (price/earnings) of the market over time, estimated using aggregated consensus earnings forecasts for each company in the index. The usual conclusion from the chart below would be that, with the market, the PE is trading close to 1 standard deviation above its long term average, the market is toward the expensive end of its range.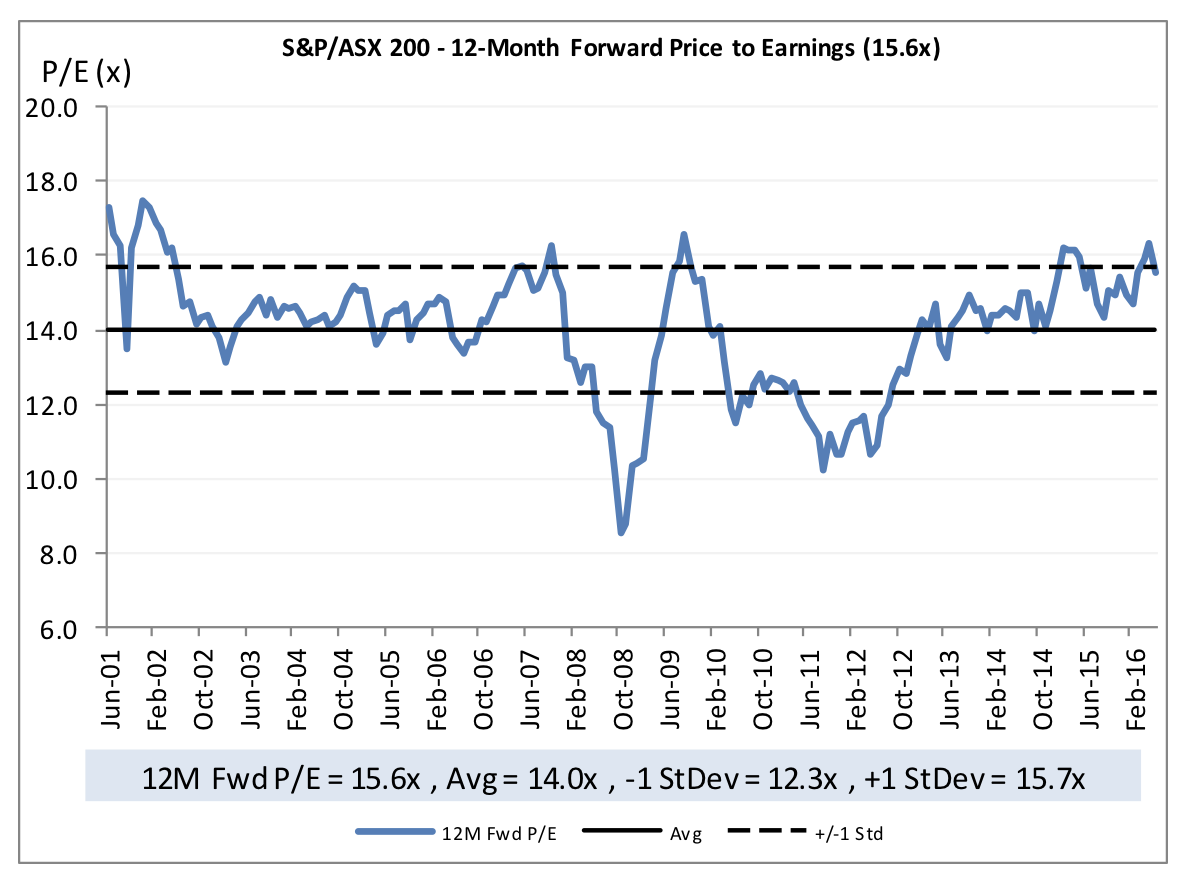 While this can be a simple tool, it is a fairly superficial one for a number of reasons. First, there are the drivers of a PE ratio: Future earnings growth, the marginal return on incremental equity to be reinvested, and the cost of equity. Any of these factors could have changed to move the PE ratio. One of the more significant factors influencing the market PE is the impact aggressive monetary expansion is having on the perceived cost of capital.
The other thing to take into account is that the estimate of the market’s 1 year forward earnings is an aggregation of the bottom-up company forecasts, weighted by the size of each company in the stated index. The problem this creates is that over time, not only do those weights change, but so do actual companies that comprise the index. More than half the companies that were in the ASX200 10 years ago are not in the index today.
Hence the mix of the three inputs to the PE equation also change over time.
Over the last 5 and 10 years, the proportion of the index represented by resources has fallen. Resources companies currently make up just under 12 per cent of the ASX200. This is down from almost 29 per cent in June 2011. The number of resources companies in the ASX200 has declined from 54 in June 2001 to 19 now.
Over the same period, the earnings base of resources companies has also declined significantly. This has the impact of shifting the market PE up on both a mix and absolute basis.
The fall in resources company earnings has seen the PE on these stocks increase significantly over the last 2 years. This increases the ASX200 PE by diluting the earnings base in the market on average.
5 years ago, the average PE of resources companies was below that of the broader ASX200, now its significantly higher. This would have reduced the PE 5 years ago relative to today. The impact on the average PE of the ASX200 from resources valuations would also have been larger 5 years ago given the significantly higher index weighting.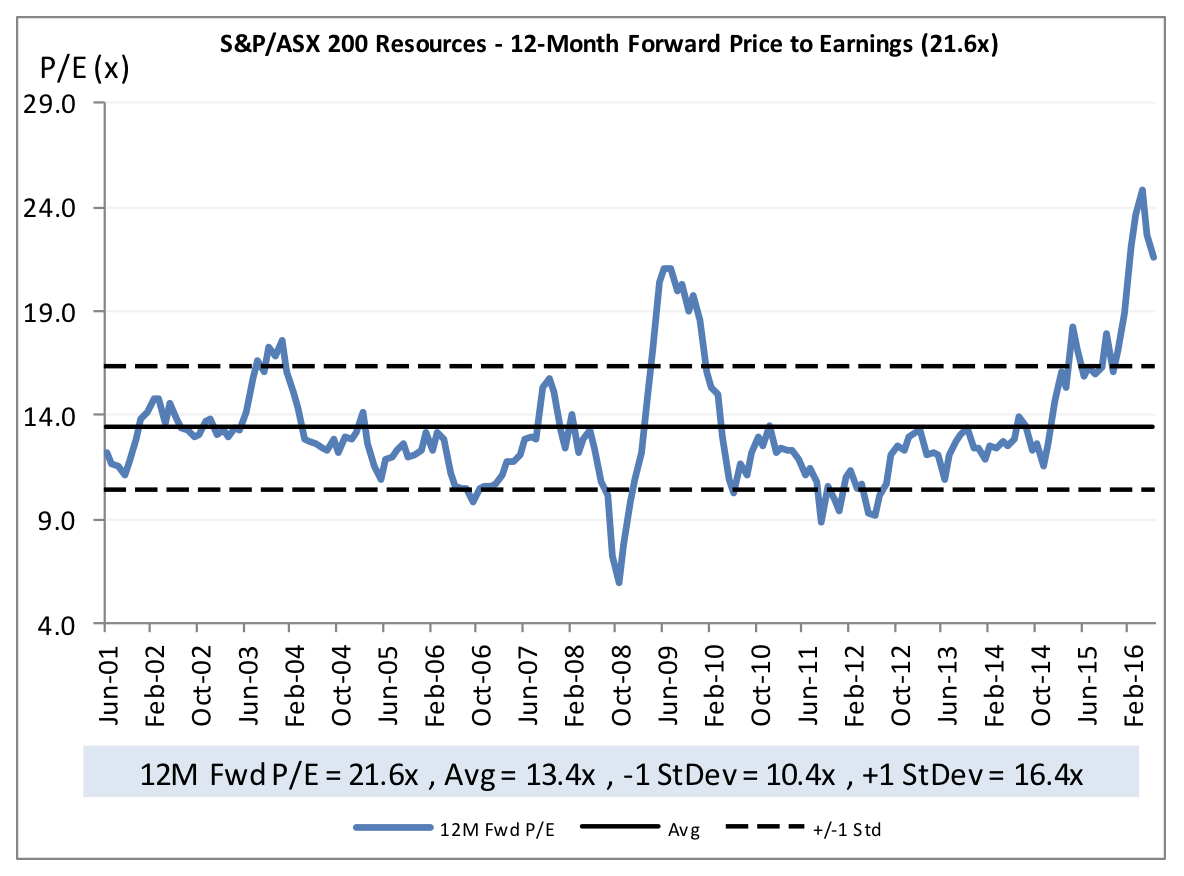
The weighting of the banks in the index has increased progressively over time. In June 2006, the banks made up 21 per cent of the index. This had increased to 25 per cent 5 years ago and currently sits at just over 28 per cent.
The increase in the weighting of the index toward banks over time results in a decrease in the average PE for the ASX200 as banks generally trade at a lower PE than the broader average. A decrease in the PE for the ASX200 on this basis would not signify that the market has become cheaper, but merely that the components of the index had changed (along with the earnings growth, cost of capital and ROE outlook).
The average PE for the banks has fallen over the last 2 years. Similar to the argument made for the broader market, we currently hear similar arguments that the banks are cheap given the PE has fallen toward a level that is 1 standard deviation below the long term average.
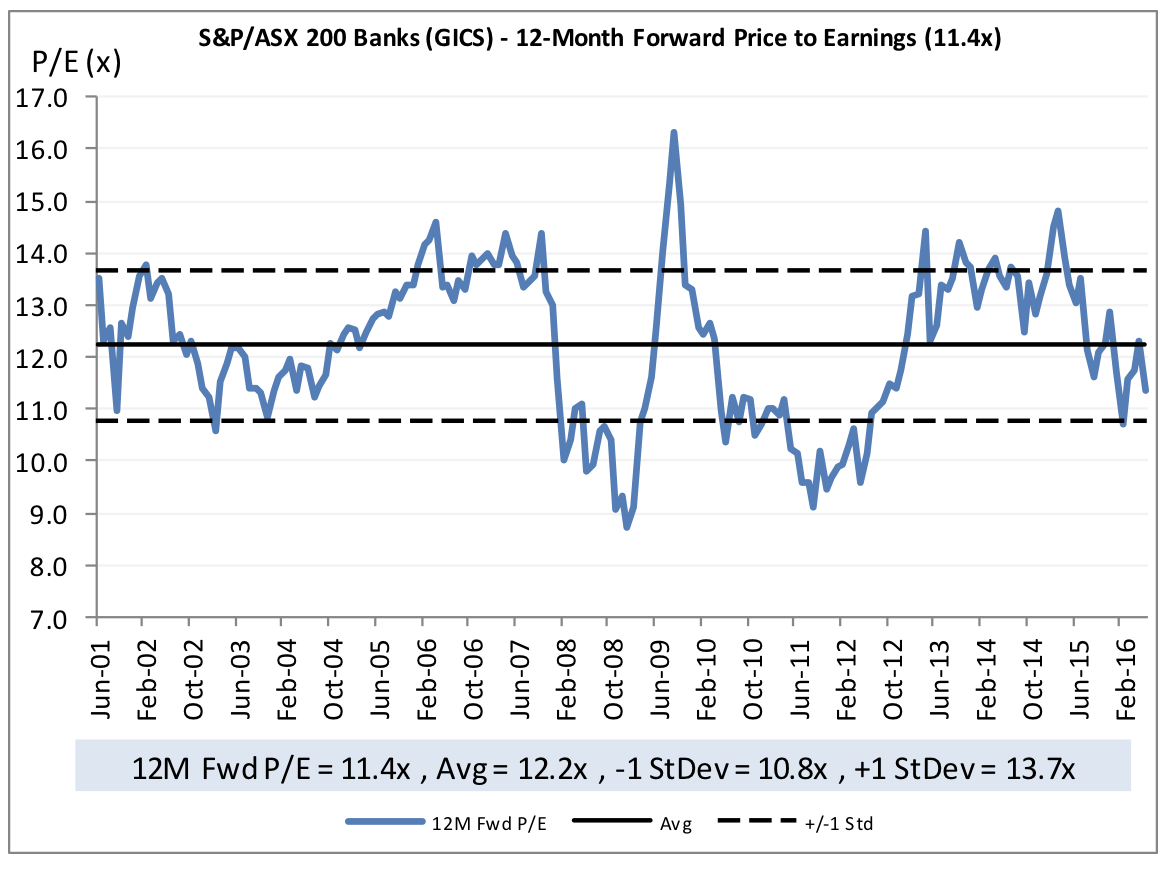
But again, this should not be seen in isolation as a reason to believe that the banks offer a good investment risk/return at current levels.
Think about the PE in the context of the outlook for marginal ROE, the cost of capital and the outlook for growth relative to 5 and 10 years ago.
The increased capital adequacy requirements being imposed on all banks, but even more so on the major banks, means that for a given amount of incremental lending, the banks need to retain a larger amount of equity capital. As a result, the ROE the banks will generate on loan growth in future is likely to be lower than was the case historically.
In terms of earnings growth rates, loan growth has been boosted over a long period of time by the falling cost of debt. Loan growth is likely to slow as we reach the bottom of the interest rate cycle. Adding to this, fee growth is also under pressure from regulatory changes (eg interchange fee caps) resulting in a weaker the outlook for revenue growth relative to historical rates of growth.
The potential for higher loan loss charges going forward as write backs of the provisions created after the GFC cease, and the level of new impairments normalise from historically low levels.
Offsetting the weaker outlook for the ROE on incremental earnings and slower earnings growth is a reduced cost of equity on the back of lower risk free rates and lower financial gearing resulting from higher regulatory capital requirements.
The net of these factors is that the banks should be trading on lower PE’s than in the past. There has been as change in the drivers of bank valuation, so historical PE’s are of little relevance when determining whether the banks stocks currently represent a good investment.
Even when we look at the average PE to the ASX200 excluding resources and banks, any upward or downward trend needs to be assessed for changes in the mix of the company weightings, or stock and sector specific issues.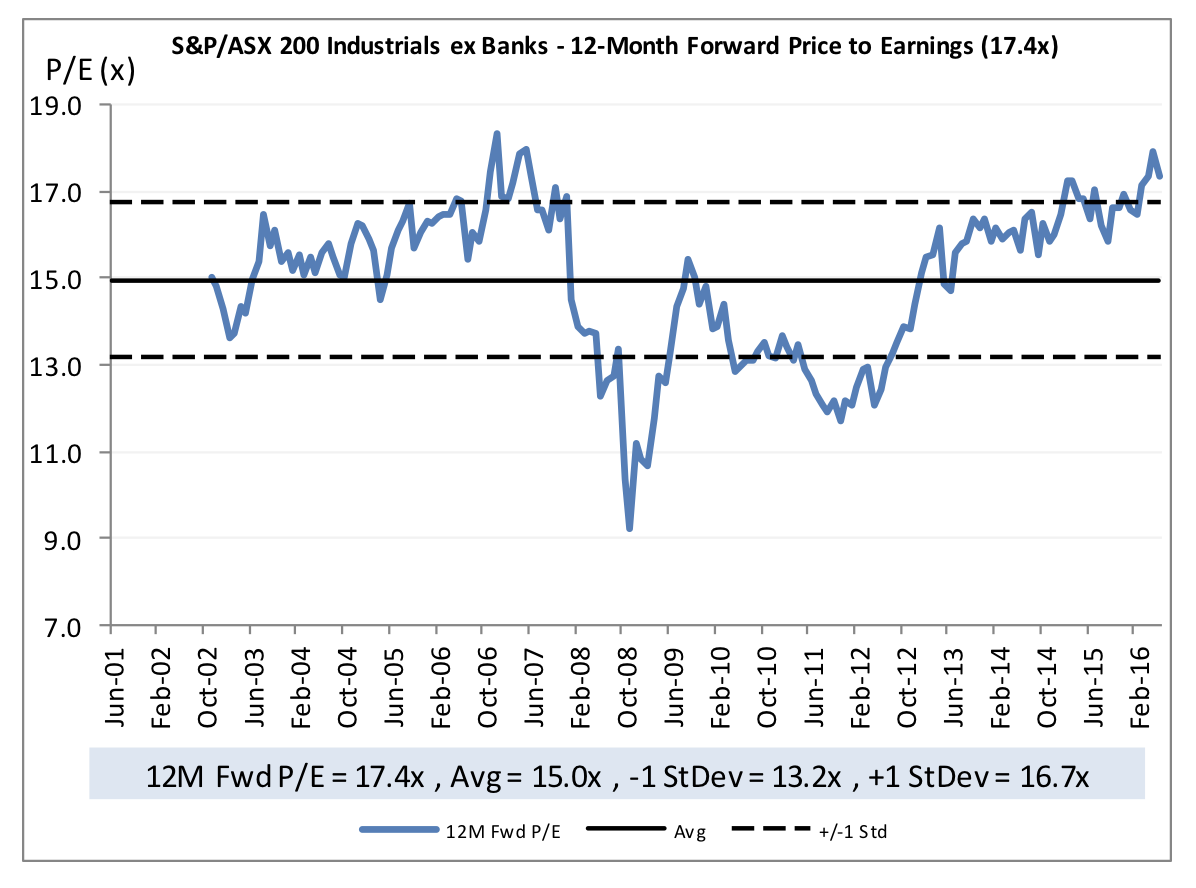
Stuart Jackson is a Senior Analyst with Montgomery Investment Management. To invest with Montgomery domestically and globally, find out more.
This post was contributed by a representative of Montgomery Investment Management Pty Limited (AFSL No. 354564). The principal purpose of this post is to provide factual information and not provide financial product advice. Additionally, the information provided is not intended to provide any recommendation or opinion about any financial product. Any commentary and statements of opinion however may contain general advice only that is prepared without taking into account your personal objectives, financial circumstances or needs. Because of this, before acting on any of the information provided, you should always consider its appropriateness in light of your personal objectives, financial circumstances and needs and should consider seeking independent advice from a financial advisor if necessary before making any decisions. This post specifically excludes personal advice.
INVEST WITH MONTGOMERY
Andrew
:
A fascinating read thanks Stuart. There are indeed risks associated with drawing inferences from long-term statistical averages & their standard deviations without an understanding of what is actually driving the real values being shown on he chart.
You mentioned decreasing earnings of resources companies driving their multiple higher & changes in the banks’ landscape that are (& should be) driving their multiple lower as likely drivers of the market’s valuation.
I listened with interest to an interview that I saw with Warren Buffett just before the last AGM of Berkshire Hathaway. He said that interest rates are to asset prices what gravity is to physical matter. He said, if interest rates were 0% & we knew they would always be 0% then it mightn’t be surprising to see assets trading at multiples of 100x. Do you think there is also a little bit of this phenomenon influencing asset prices at the moment too? (I noted Roger’s comments to the same effect in his post today regarding property prices). Are we seeing a new “normal” with PE’s being driven by today’s cheap debt?
Stuart Jackson
:
Thanks Andrew. The issue of the appropriate cost of capital and whether there has been a structural change in the cost of capital given the sustained zero interest rate policies of a number of the major central banks around the world is something we discuss frequently. The first point I would make is that equities are real assets, while interest rates are nominal. Consequently, you need to determine the driver of lower interest rates. Is it a reduction in long term inflation expectations, or is it a compression in real yields? If it is just inflation, then the outlook for earnings growth will be similarly impacted, offsetting the benefit to valuation from using a lower discount rate. In the case of falling long term bond rates around the world, the drivers are a mix of both falling inflation (deflation) impacts, as well as distortions to the real risk free rate of return caused by aggressive central bank balance sheet expansion.
The second factor is that a lower risk free rate does not necessarily mean the cost of equity falls. If falling risk free rates of return are occurring at the same time as investor risk aversion is increasing, the impact on the cost of equity would be offset by an increase in the equity risk premium. Essentially, lower risk free rates could be a sign of lower investor confidence and tolerance for risk rather than lower return requirements across all investment options.
In the current market, we would suggest that equities prices are factoring lower returns going forward. In other words, high share prices are likely to have been driven, at least to some extent, by a reduction in the discount rate or cost of capital used in valuing the businesses. However, the fall in the discount rate on equities has been less than that of risk free assets, implying that the equity risk premium has increased to some extent as an offset.