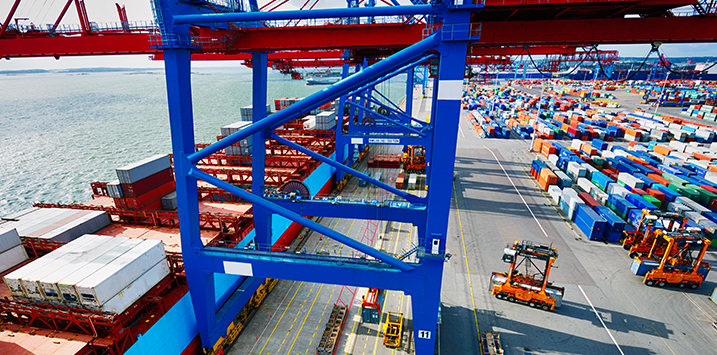
Global shipping tells the story of a sluggish world economy
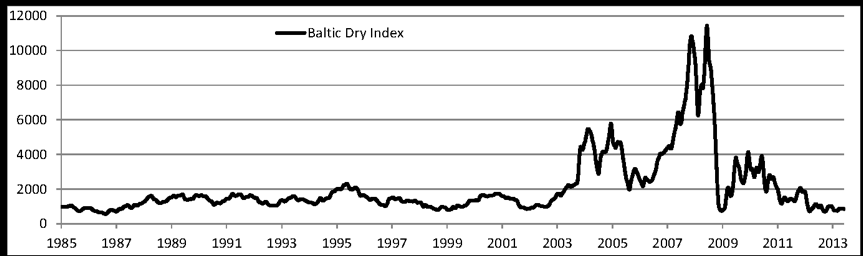
The Baltic Dry Index (BDI) reflects global demand for major raw materials – like coal, iron ore and grain. It is therefore a leading indicator of future economic activity. So it pays to watch it closely. Right now, the index does not fill us with confidence.
Looking at the chart for the BDI (see below) you can see that global shipping is in the doldrums. The index has traded down from 11,793 in June 2008 to the current 850.
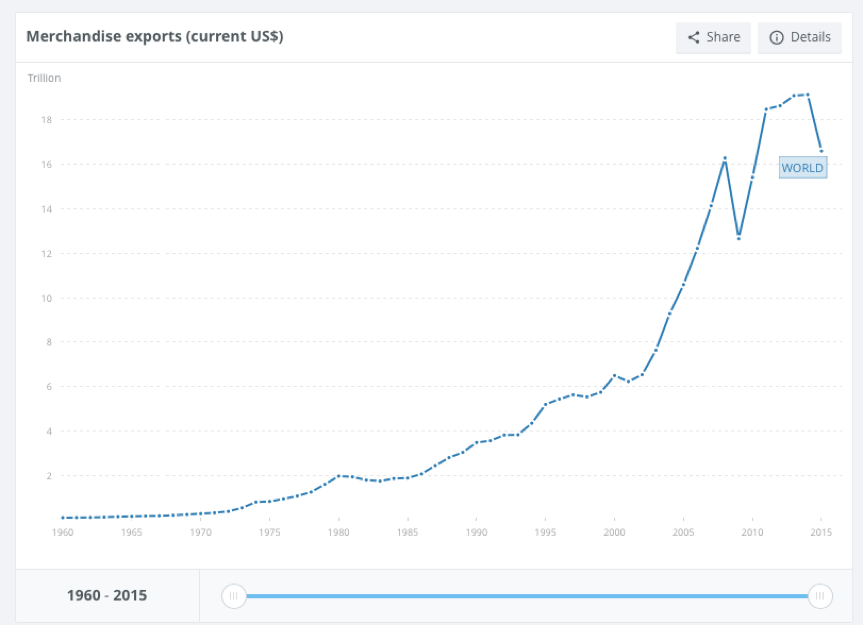
World Bank figures claim global merchandise exports fell by 13 per cent or US$2.54 trillion in 2015 to US$16.58 trillion. This coincided with the expansion of the Panama Canal, a conduit for 5 per cent of the world’s maritime commercial traffic. ‘Mega-ships’ carrying up to 14,000 containers have traversed the canal from late June.
Hanjin Shipping, South Korea’s largest and the world’s seventh largest container shipping line, hobbled with more than US$5 billion of debt, filed for bankruptcy in August. In September, the Danish-based AP Moller-Maersk announced it would break itself into two companies, one an energy business and the other a transport and logistics business. CEO Soren Skou partly blamed ‘near-shoring’, the outsourcing of work to nearby countries, instead of countries across the other side of the world.
And with efficiency gains from bigger container ships steadily declining, and the new larger ships possibly raising the cost of transporting goods, an industry used to ‘bigger’ may have to find new ways to survive.
To that end, the Korean Government has just announced a US$9.6 billion ‘bail in’ fund with the proposal to award 63 new builds over the next few years. Contrary to industry expectations, Korea’s Big 3 – Hyundai Heavy Industries (market capitalisation of US$9.7 billion), Samsung Heavy Industries (US$3.2 billion) and Daewoo Shipbuilding (US$1.1 billion) – will spin off or sell their non-shipbuilding assets, are to be retained.
Finally, Japan’s largest shipping companies are merging their container operations, with the objective of becoming more efficient by delivering expected savings of US$1b per year. Nippon Yusen, Mitsui OSK Lines and Kawasaki Kisen Kaisha will have a fleet of 256 container vessels, about 7 per cent of the world shipping market.
Chief Executive Officer of Montgomery Investment Management, David Buckland has over 30 years of industry experience. David is a deeply knowledgeable and highly experienced financial services executive. Prior to joining Montgomery in 2012, David was CEO and Executive Director of Hunter Hall for 11 years, as well as a Director at JP Morgan in Sydney and London for eight years.
This post was contributed by a representative of Montgomery Investment Management Pty Limited (AFSL No. 354564). The principal purpose of this post is to provide factual information and not provide financial product advice. Additionally, the information provided is not intended to provide any recommendation or opinion about any financial product. Any commentary and statements of opinion however may contain general advice only that is prepared without taking into account your personal objectives, financial circumstances or needs. Because of this, before acting on any of the information provided, you should always consider its appropriateness in light of your personal objectives, financial circumstances and needs and should consider seeking independent advice from a financial advisor if necessary before making any decisions. This post specifically excludes personal advice.
darren franklin
:
David just another example of an industry with overcapacity issues that are being worked through. Regards
darren franklin
:
David, both charts just suggest the last 10 or so years was an aberation and we are just going back to the longer term trend. It is where the trend goes from here that will tell the story.
David Buckland
:
Thanks Darren. It sure looks like a tough space and maybe we have seen a peak in “globalisation” of goods.